Unlock Secrets: Polydispersity Index Distribution Explained
Understanding the relationship between polymers and their properties requires a solid grasp of polydispersity index distribution. Dynamic Light Scattering (DLS), a technique widely used in Malvern Panalytical laboratories, relies on accurate assessment of this distribution to characterize materials. Moreover, the Molar mass distribution will influence on polymer’s properties. Therefore, analyzing polydispersity index distribution is critical for researchers in material science striving to tailor properties and processes effectively.
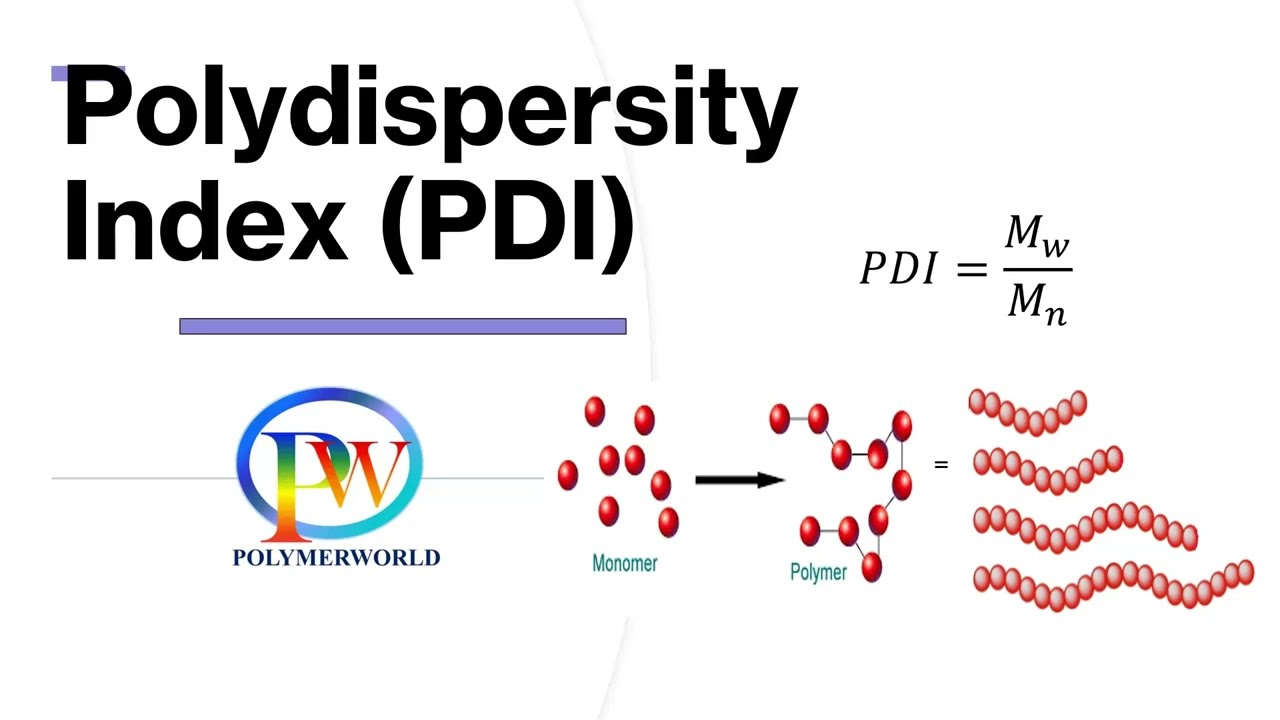
Image taken from the YouTube channel PolymerWorld , from the video titled Polydispersity Index .
Deconstructing Polydispersity Index Distribution: An In-Depth Guide
Understanding the polydispersity index distribution is crucial in various fields, particularly polymer science, materials science, and pharmaceuticals. This guide breaks down the concept, its significance, and how it’s characterized. The primary focus will be on the polydispersity index distribution and related concepts.
What is Polydispersity Index (PDI)?
At its core, the polydispersity index (PDI) is a measure of the distribution of molecular weights within a polymer sample. Instead of all molecules having exactly the same size, they usually exist in a range. PDI quantifies the breadth of this range.
- A PDI of 1 indicates a perfectly uniform sample (monodisperse), meaning all molecules have the same molecular weight. This is theoretically ideal, but rarely achievable in practice.
- Values greater than 1 indicate a polydisperse sample, where there’s a distribution of molecular weights. A higher PDI signifies a broader distribution.
Why is PDI Important?
PDI significantly affects the properties of materials.
- Mechanical Properties: Polymers with a narrow molecular weight distribution (low PDI) often exhibit more consistent and predictable mechanical properties, such as tensile strength and elasticity.
- Processing: PDI influences how easily a polymer can be processed, impacting molding, extrusion, and film formation.
- Performance: In pharmaceutical applications, PDI can affect drug release rates and bioavailability.
Understanding Molecular Weight Averages
Before delving deeper into PDI distribution, it’s essential to understand the different types of molecular weight averages used in its calculation. These averages provide different perspectives on the molecular weight profile.
Number Average Molecular Weight (Mn)
Mn is the total weight of all polymer molecules in a sample divided by the total number of molecules. It’s sensitive to the presence of smaller molecules.
- Formula: Mn = Σ(Ni * Mi) / ΣNi, where Ni is the number of molecules with molecular weight Mi.
Weight Average Molecular Weight (Mw)
Mw is calculated by weighting the contribution of each molecule by its weight. It is more sensitive to larger molecules in the sample.
- Formula: Mw = Σ(Wi Mi) / ΣWi = Σ(Ni Mi^2) / Σ(Ni * Mi), where Wi is the weight fraction of molecules with molecular weight Mi.
How are Mn and Mw related to PDI?
PDI is calculated as the ratio of Mw to Mn:
- PDI = Mw / Mn
Polydispersity Index Distribution: A Deeper Dive
While the PDI value itself is a useful metric, it provides only a single-point description. A more comprehensive understanding requires examining the entire polydispersity index distribution. This involves visualizing the relative abundance of molecules at each molecular weight.
Methods to Determine Molecular Weight Distribution
Several techniques can be used to determine the molecular weight distribution, each with its own advantages and limitations.
-
Size Exclusion Chromatography (SEC), also known as Gel Permeation Chromatography (GPC):
- This is the most common method. Polymer molecules are separated based on their size as they pass through a porous gel matrix.
- Smaller molecules penetrate the pores more readily, taking a longer path, while larger molecules are excluded and elute faster.
- The eluting molecules are detected, and the concentration is plotted as a function of elution time, which is then correlated to molecular weight using calibration standards.
-
Mass Spectrometry (MS):
- MS can provide highly accurate molecular weight information, especially when coupled with techniques like SEC.
- It measures the mass-to-charge ratio of ions, allowing for precise determination of molecular weights.
-
Light Scattering:
- Light scattering techniques measure the intensity of light scattered by polymer molecules in solution.
- This information can be used to determine the molecular weight and size of the molecules.
Visualizing the Distribution
The data obtained from SEC/GPC or other techniques can be plotted as a distribution curve. This curve typically shows the relative concentration (or weight fraction) of molecules as a function of molecular weight.
- X-axis: Molecular weight (often on a logarithmic scale)
- Y-axis: Relative concentration or weight fraction
Interpreting the Distribution Curve
The shape of the distribution curve provides valuable insights.
- Narrow Peak: Indicates a narrow molecular weight distribution (low PDI).
- Broad Peak: Indicates a wide molecular weight distribution (high PDI).
- Multiple Peaks (Multimodal Distribution): Suggests the presence of multiple polymer populations with different average molecular weights. This could arise from different polymerization mechanisms or the presence of different polymer types within the sample.
Example:
| Feature | Interpretation |
|---|---|
| Single, narrow peak | Monodisperse or nearly monodisperse polymer; good control over polymerization. |
| Broad peak | Polydisperse polymer; wider range of molecular weights. |
| Bimodal distribution | Mixture of two polymer populations with distinct average molecular weights. Requires further investigation to understand the cause. |
Factors Influencing PDI Distribution
Several factors influence the polydispersity index distribution during polymer synthesis.
- Polymerization Mechanism: Different polymerization mechanisms (e.g., chain-growth, step-growth) inherently lead to different PDI values. Chain-growth polymerization can produce polymers with narrower distributions under controlled conditions.
- Reaction Conditions: Temperature, pressure, solvent, and the presence of impurities can all affect the PDI.
- Catalyst System: The choice of catalyst and its activity significantly impact the polymerization rate and the resulting molecular weight distribution. Controlled radical polymerization techniques, for instance, use specialized catalysts to produce polymers with low PDI.
- Monomer Purity: Impurities in the monomer can act as chain transfer agents, leading to broader distributions.
FAQs: Understanding Polydispersity Index Distribution
This FAQ section clarifies common questions about the polydispersity index distribution and its significance in polymer science.
What does a higher Polydispersity Index (PDI) indicate?
A higher PDI indicates a wider range of molecular weights within a polymer sample. This means the sample is less uniform, containing chains of significantly different lengths. The polydispersity index distribution thus reflects the degree of heterogeneity.
Why is the Polydispersity Index important?
The PDI provides crucial information about a polymer’s properties. The polydispersity index distribution affects factors like melting point, viscosity, and mechanical strength. Knowing the PDI helps predict and control a polymer’s behavior in various applications.
How is the Polydispersity Index typically determined?
The PDI is commonly measured using techniques like Gel Permeation Chromatography (GPC), also known as Size Exclusion Chromatography (SEC). This method separates polymer chains based on size, allowing calculation of the polydispersity index distribution.
Is a PDI of 1.0 achievable in real-world polymer samples?
A PDI of 1.0 represents a perfectly monodisperse sample, meaning all polymer chains are exactly the same length. While theoretically possible, achieving a PDI of 1.0 is extremely rare in practice. Almost all real-world polymers exhibit some degree of polydispersity index distribution.
And that’s a wrap on polydispersity index distribution! Hopefully, you’ve found this helpful and have a better understanding now. Go forth and explore!
