Oxygen Phase Diagram: Everything You Need to Know!
Understanding the behavior of oxygen under varying conditions is critical, and the oxygen phase diagram serves as a vital tool in this endeavor. Cryogenic research extensively utilizes this diagram to predict oxygen’s state at extremely low temperatures. The National Institute of Standards and Technology (NIST) provides crucial thermodynamic data, allowing for accurate construction and interpretation of the oxygen phase diagram. Knowledge of the oxygen phase diagram also has significance in materials science, particularly when assessing the behavior of superconductors in oxygen-rich environments.
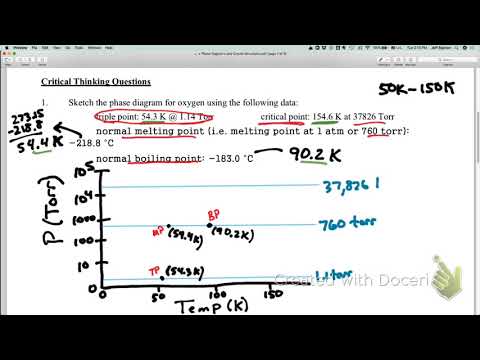
Image taken from the YouTube channel Jeffrey Sigman , from the video titled Phase Diagram O2 – Rough Drawing .
Oxygen Phase Diagram: Understanding Its Phases and Transitions
The "oxygen phase diagram" visually represents the stable phases of oxygen under different temperature and pressure conditions. Understanding this diagram is crucial for various scientific and engineering applications, from cryogenics to materials science. This document will guide you through the essential elements of an oxygen phase diagram and how to interpret it.
Key Components of the Oxygen Phase Diagram
Before diving into specific phases, it’s essential to understand the key components depicted in a standard phase diagram:
- Axes: Typically, the axes represent pressure (usually in Pascals, atmospheres, or bars) on the y-axis and temperature (usually in Kelvin or Celsius) on the x-axis.
- Phase Boundaries (Curves): These lines represent the equilibrium conditions where two phases can coexist. They demarcate regions on the diagram that correspond to stable phases. Crossing a phase boundary indicates a phase transition.
- Triple Point: The point where three phases coexist in equilibrium. Oxygen has multiple triple points.
- Critical Point: The point beyond which there is no distinction between the liquid and gas phases.
Phases of Oxygen
Oxygen exhibits various solid, liquid, and gaseous phases, each with unique properties. Understanding these phases is crucial to interpreting the oxygen phase diagram.
Gaseous Oxygen (O₂ Gas)
- This is the most common phase of oxygen under ambient conditions (room temperature and atmospheric pressure).
- In the phase diagram, this region is located in the lower right, corresponding to high temperatures and low pressures.
Liquid Oxygen (LOX)
- Liquid oxygen is formed at cryogenic temperatures.
- It occupies a region in the middle-right of the phase diagram, representing lower temperatures and higher pressures than the gaseous phase.
- Liquid oxygen is commonly used as an oxidizer in rocket propellants and in medical applications.
Solid Oxygen Phases
Solid oxygen exhibits several distinct crystalline structures depending on temperature and pressure. These are typically designated with Greek letters. Each phase has a different crystal structure and magnetic properties.
-
α-Oxygen: This phase exists at the lowest temperatures and is a blue, monoclinic crystal.
- It is antiferromagnetic.
- Stable at low temperatures and moderate pressures.
-
β-Oxygen: A pale pink, rhombohedral crystal stable at slightly higher temperatures than α-oxygen.
- It is also antiferromagnetic.
-
γ-Oxygen: An orange, cubic crystal stable at even higher temperatures than the previous two phases, but still at cryogenic temperatures.
-
δ-Oxygen: Only exists at higher pressures.
-
ε-Oxygen: Also known as red oxygen. This phase forms at very high pressures.
-
Its structure is complex and not fully understood.
-
Displays metallic properties.
-
The different solid phases will each have distinct regions on the phase diagram. The diagram shows how pressure and temperature determine which solid form is stable.
Here’s a table summarizing the solid phases:
| Phase | Color | Crystal Structure | Magnetic Properties | Pressure/Temperature Conditions |
|---|---|---|---|---|
| α-Oxygen | Blue | Monoclinic | Antiferromagnetic | Low Temperature, Moderate Pressure |
| β-Oxygen | Pale Pink | Rhombohedral | Antiferromagnetic | Moderate Temperature, Moderate Pressure |
| γ-Oxygen | Orange | Cubic | Paramagnetic | Higher Temperature, Moderate Pressure |
| δ-Oxygen | Unknown | Unknown | Unknown | High Pressure, Moderate Temperature |
| ε-Oxygen | Red | Complex, Unknown | Metallic | Very High Pressure, Higher Temperature |
Understanding Phase Transitions
The lines on the oxygen phase diagram represent phase transitions – the conditions under which oxygen changes from one phase to another.
Vaporization/Condensation
- The curve separating the liquid and gas phases shows the conditions at which oxygen boils (vaporizes) or condenses.
Melting/Freezing
- The curve separating the solid and liquid phases indicates the conditions at which oxygen melts or freezes.
Sublimation/Deposition
- The curve separating the solid and gas phases shows the conditions at which oxygen sublimates (directly from solid to gas) or deposits (directly from gas to solid).
Solid-Solid Transitions
- The lines separating the different solid phases (α, β, γ, etc.) indicate the conditions at which oxygen changes from one crystalline structure to another.
Interpreting the Oxygen Phase Diagram: Examples
To effectively use the oxygen phase diagram, consider these practical examples:
-
Liquefying Oxygen: Starting with gaseous oxygen at atmospheric pressure (1 atm) and room temperature (25°C), follow a vertical line down the diagram (representing decreasing temperature at constant pressure). You will cross the gas-liquid phase boundary, indicating condensation into liquid oxygen. The temperature at which you cross the boundary is the boiling point of oxygen at 1 atm.
-
Solidification of Oxygen: Starting with liquid oxygen, continue decreasing the temperature. You’ll cross the liquid-solid phase boundary, resulting in solidification into one of the solid phases (determined by the specific temperature and pressure).
-
High-Pressure Oxygen: If you compress gaseous oxygen to extremely high pressures (e.g., >10 GPa), even at relatively low temperatures, you will likely enter the realm of the ε-oxygen (red oxygen) phase.
Oxygen Phase Diagram: Frequently Asked Questions
Still have questions about oxygen’s behavior under different conditions? Here are some common queries about the oxygen phase diagram.
What are the common phases of oxygen?
The most commonly encountered phase of oxygen is, of course, gas at room temperature and pressure. However, the oxygen phase diagram also shows solid and liquid phases at lower temperatures and higher pressures. These different solid phases are structurally distinct from one another.
Why is the oxygen phase diagram important?
The oxygen phase diagram is crucial for understanding how oxygen behaves under extreme conditions, such as those found in scientific research, industrial processes, and even planetary environments. Understanding these phases helps researchers predict and control reactions involving oxygen.
What factors influence the phase of oxygen?
Temperature and pressure are the two key factors that determine the phase of oxygen. The oxygen phase diagram visually represents the relationship between these two variables and shows which phase is stable under given conditions.
What are the different solid phases indicated on the oxygen phase diagram?
The oxygen phase diagram shows multiple solid phases, often designated with Greek letters (e.g., α, β, γ). Each of these phases represents a different crystal structure of solid oxygen, formed under specific temperature and pressure ranges. Each phase has distinct properties.
So there you have it – a solid overview of the oxygen phase diagram! Hopefully, you’ve got a better grasp of how it all works. Next time you’re pondering the states of oxygen, remember what we covered here. Until then, keep exploring!
