Koppen Climate Map: Decode US Weather Like a Pro!
The Köppen climate classification system, a world-renowned framework developed by Wladimir Köppen, categorizes global climates based on temperature and precipitation patterns. The United States, exhibiting a diverse range of geographical features, can be readily understood through the lens of a koppen climate map. Such a map helps illustrate how elements like the Global Precipitation Climatology Centre (GPCC) data correlate with regional climate types, offering a systematic approach to understanding US weather patterns. This article elucidates how to effectively decode weather phenomena across the country using the koppen climate map as a primary tool.
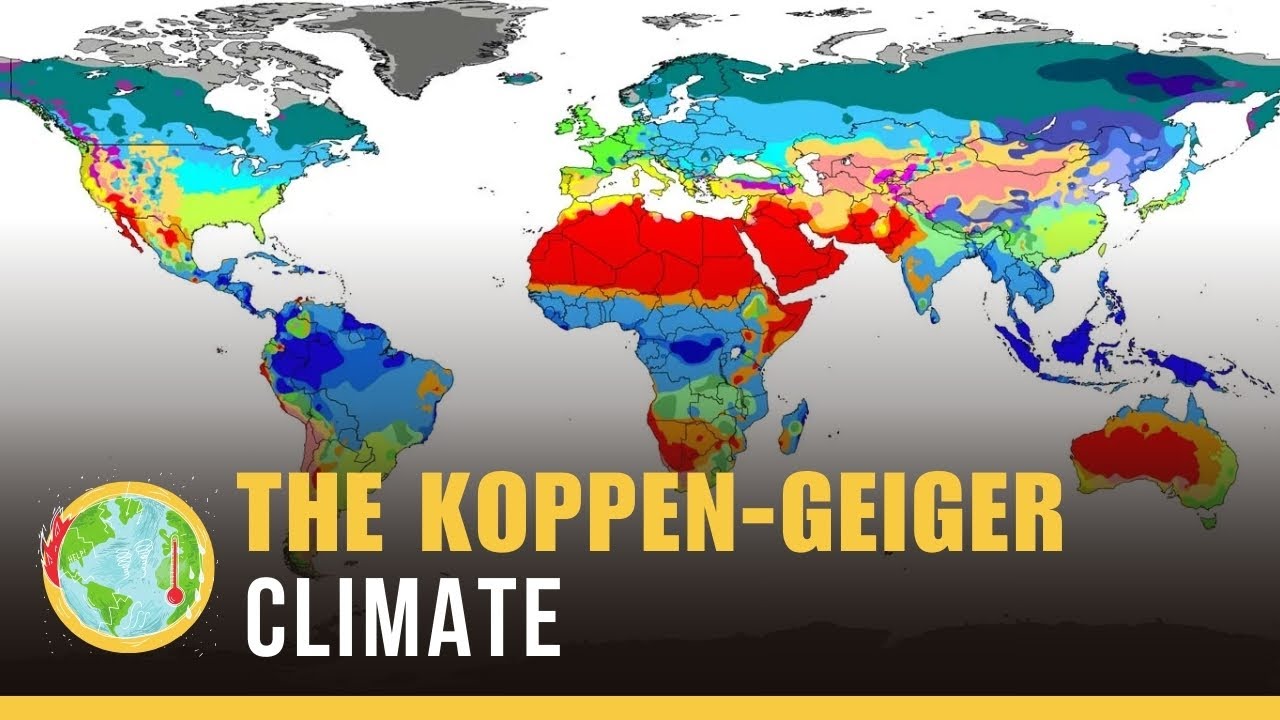
Image taken from the YouTube channel Planetic , from the video titled The Koppen-Geiger Climate Classification System .
Decoding US Weather: Your Guide to the Köppen Climate Map
The Köppen climate map provides a standardized, visually intuitive system for classifying the world’s climates. Understanding how to read and interpret this map, particularly for the United States, allows anyone to quickly grasp the prevalent weather patterns in a given region. This guide will walk you through the basics, focusing on how to use the Köppen climate map as a tool to understand US weather conditions.
Understanding the Köppen System
The Köppen climate classification system is based on observable vegetation characteristics and temperature and precipitation data. It divides climates into five main groups (A, B, C, D, E), each further subdivided based on specific temperature and precipitation thresholds.
Main Climate Groups
- A: Tropical Climates: High temperatures year-round with abundant rainfall. Found primarily in tropical regions.
- B: Dry Climates: Characterized by low precipitation levels. Includes deserts and steppes.
- C: Temperate Climates: Mild winters and warm to hot summers. Found in mid-latitudes.
- D: Continental Climates: Cold winters and warm to cool summers. Only found in the Northern Hemisphere.
- E: Polar Climates: Very cold temperatures year-round. Includes tundra and ice cap climates.
Each of these main groups is further defined by secondary and tertiary classifications denoted by lowercase letters and sometimes a third uppercase letter. These additional classifications specify rainfall patterns (e.g., f for wet year-round, s for dry summer, w for dry winter) and temperature characteristics (e.g., a for hot summer, b for warm summer, c for cool summer, d for very cold winter).
Applying the Köppen Climate Map to the United States
The continental United States showcases a diverse range of Köppen climate classifications, from tropical climates in southern Florida to polar climates in high-altitude regions of Alaska. Understanding the distribution of these climates is key to "decoding" US weather.
Common US Climate Classifications
Here’s a breakdown of some common Köppen classifications found in the US, and where you’ll likely encounter them:
| Climate Code | Description | Location Examples | Typical Weather Characteristics |
|---|---|---|---|
| Cfa | Humid Subtropical: Hot, humid summers; mild winters. | Southeastern US (e.g., Florida, Georgia, coastal Carolinas) | Hot, humid summers with frequent thunderstorms; mild winters with occasional frosts. |
| Cfb | Marine West Coast: Mild summers and mild winters. | Pacific Northwest (e.g., Washington, Oregon) | Moderate temperatures year-round; wet winters and relatively dry summers. |
| Csa | Mediterranean: Hot, dry summers; mild, wet winters. | Coastal California | Warm to hot, dry summers; mild, wet winters; frequent sunshine. |
| Dfa | Humid Continental: Hot summers, cold winters. | Midwestern US (e.g., Illinois, Ohio) | Hot, humid summers; cold, snowy winters; four distinct seasons. |
| Dfb | Humid Continental: Warm summers, cold winters. | Northern US (e.g., Minnesota, Maine) | Warm summers; long, cold, snowy winters; shorter growing season compared to Dfa. |
| BSk | Semi-Arid Climate: Dry, but not extremely arid. | Great Plains (e.g., Montana, Nebraska) | Hot summers; cold winters; low precipitation, but more than a desert climate. |
| BWh | Hot Desert: Very dry and very hot. | Southwestern US (e.g., Arizona, Nevada) | Extremely hot summers; mild winters; very low precipitation; high evaporation rates. |
| ET | Tundra Climate: Cold, treeless environment. | Northern Alaska | Short, cool summers; long, extremely cold winters; permafrost. |
Regional Variations
Examining a Köppen climate map of the US reveals distinct regional patterns:
- East Coast: Predominantly Cfa (Humid Subtropical) transitioning to Dfa and Dfb (Humid Continental) as you move north. This translates to hot, humid summers in the Southeast and progressively colder winters further north.
- West Coast: Dominated by Csa (Mediterranean) in Southern California and Cfb (Marine West Coast) in the Pacific Northwest. This gives California its characteristic dry summers and mild winters, while the Pacific Northwest is known for its wet winters and moderate temperatures.
- Interior Plains: Transitions from Cfa in the southern plains to Dfa/Dfb further north, then to BSk (Semi-Arid) in the western plains. Expect significant temperature fluctuations throughout the year and increasingly drier conditions westward.
- Southwest: Largely BWh (Hot Desert), characterized by extremely arid conditions and high temperatures.
- Mountain West: Highly variable due to altitude. Expect cooler temperatures and often wetter conditions at higher elevations, reflected in localized variations of D and E climates.
Using the Map for Weather Prediction
While the Köppen climate map doesn’t predict day-to-day weather, it offers insights into the expected range of weather conditions for a given region.
- Travel Planning: Helps anticipate typical weather conditions for travel destinations.
- Agricultural Planning: Guides crop selection based on expected temperature and precipitation patterns.
- Infrastructure Design: Informs building codes and infrastructure planning to account for climate-related stresses.
- Ecological Understanding: Explains the distribution of plant and animal life.
By understanding the Köppen classification of a region, you can gain a broader understanding of the weather patterns to expect, even without detailed weather forecasts. This helps to "decode" the overall weather profile of the United States.
Koppen Climate Map: Frequently Asked Questions
Here are some common questions about understanding and using the Köppen climate map to decode US weather patterns.
What exactly is the Köppen climate map?
The Köppen climate map is a globally recognized system for classifying climates based on temperature and precipitation. It helps visualize different climate zones around the world, including the US, making it easier to understand expected weather patterns.
How does the Köppen climate map help me understand US weather better?
By looking at the Köppen climate map, you can quickly identify the dominant climate zone in your region or any area of the US you’re interested in. Knowing the climate zone helps you anticipate typical temperatures, rainfall amounts, and seasonal changes. This makes the köppen climate map an important reference.
What are the main climate categories in the Köppen climate map and how do they apply to the US?
The major Köppen climate categories are Tropical (A), Dry (B), Temperate (C), Continental (D), and Polar (E). In the US, you’ll find examples of most of these, from the tropical climate of South Florida to the continental climates of the Midwest and the dry climates of the Southwest, easily identifiable using the köppen climate map.
Where can I find a detailed Köppen climate map of the US?
Many websites offer Köppen climate maps of the world, including the US. Search for "Köppen climate map US" using your favorite search engine. Be sure to check the map’s source and date to ensure accuracy. Understanding the climate zones as defined by the köppen climate map allows for more comprehensive weather comprehension.
So, there you have it! Now you’ve got the basic knowledge to start exploring the koppen climate map and understanding the US weather a little better. Happy decoding!
