Chi-Squared Test: Comparing Two Samples the Right Way!
The **Chi-Squared test**, a cornerstone of statistical analysis, facilitates comparisons between observed and expected frequencies. SPSS, a popular statistical software package, often plays a crucial role in computing this test. Understanding its proper application is vital, as emphasized by statisticians like **Karl Pearson**, a key figure in its development. Accurate reporting chi squared for two different samples requires careful consideration of degrees of freedom and significance levels, especially when analyzing data sets arising from distinct **populations**. Failure to appropriately consider these factors may lead to erroneous conclusions. Our objective is to equip you with the knowledge to execute and interpret this test correctly.
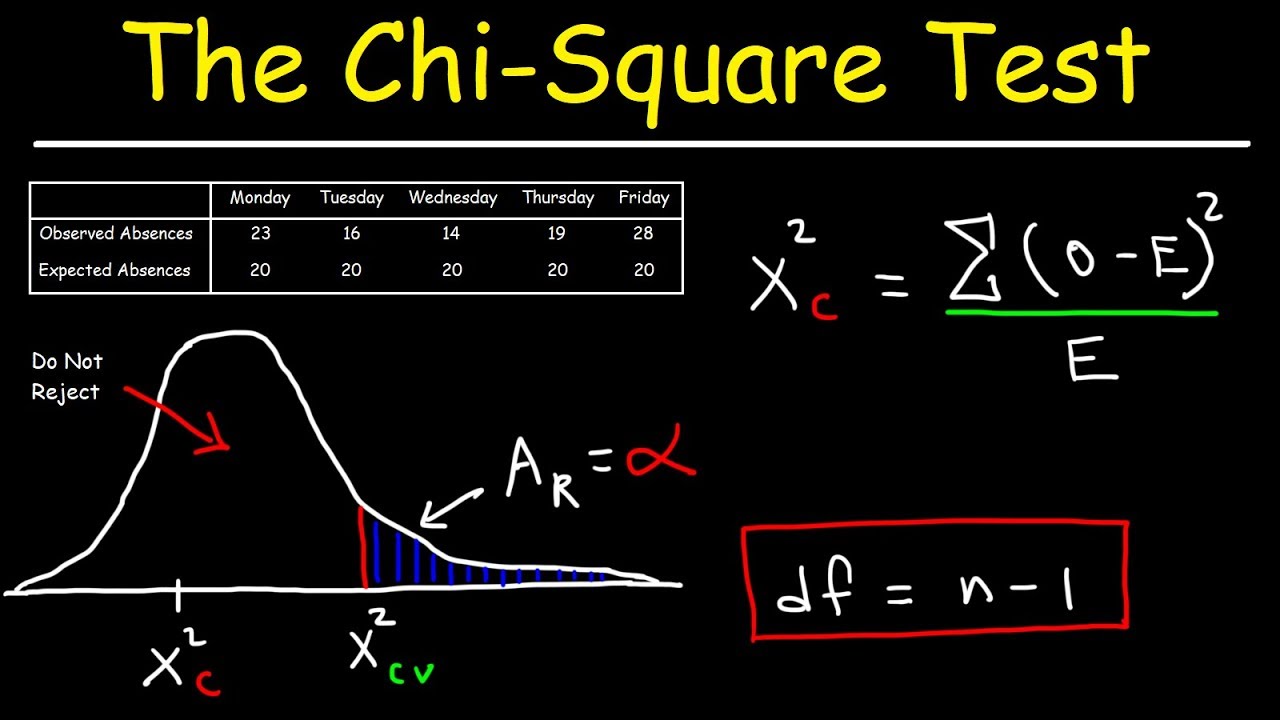
Image taken from the YouTube channel The Organic Chemistry Tutor , from the video titled Chi Square Test .
Chi-Squared Test: Comparing Two Samples Effectively
The Chi-Squared test is a statistical tool used to determine if there’s a significant association between two categorical variables. When applied to two different samples, it allows us to assess whether the observed differences in proportions are likely due to chance or represent a genuine underlying relationship. Correctly reporting chi squared for two different samples is crucial for clear communication and proper interpretation of the findings.
Understanding the Chi-Squared Test Fundamentals
Before diving into reporting, let’s establish a firm understanding of the test itself.
What Does the Chi-Squared Test Do?
The Chi-Squared test evaluates the discrepancy between observed frequencies (the actual data collected) and expected frequencies (the frequencies we’d expect if there was no association between the variables). A large discrepancy suggests a strong association. The focus here is on comparing two different samples, meaning we are comparing how categorical variables are distributed across these samples.
Key Assumptions of the Chi-Squared Test
The Chi-Squared test relies on several assumptions to ensure its validity:
- Independence of Observations: Each observation should be independent of the others. One person’s response should not influence another’s.
- Random Sampling: Data should be collected through random sampling to avoid bias.
- Expected Cell Counts: Most expected cell counts should be 5 or greater. If this assumption is violated, consider using alternative tests like Fisher’s Exact Test, especially with small sample sizes.
Calculating the Chi-Squared Statistic
The Chi-Squared statistic (χ²) is calculated using the following formula:
χ² = Σ [(Observed Frequency – Expected Frequency)² / Expected Frequency]
Where:
- Σ represents the summation across all cells in the contingency table.
- Observed Frequency is the actual count in each cell.
- Expected Frequency is the count we would expect in each cell if there was no association between the variables.
Calculating Expected Frequencies
The expected frequency for each cell is calculated as:
Expected Frequency = (Row Total * Column Total) / Grand Total
Consider a 2×2 contingency table for comparing "Preference for Brand A" vs. "Preference for Brand B" across Sample 1 and Sample 2:
| Sample 1 | Sample 2 | Row Total | |
|---|---|---|---|
| Brand A | 50 | 70 | 120 |
| Brand B | 60 | 40 | 100 |
| Col Total | 110 | 110 | 220 |
The Expected Frequency for Sample 1 choosing Brand A would be (120 * 110) / 220 = 60.
Reporting Chi Squared for Two Different Samples: Essential Elements
When reporting chi squared for two different samples, include the following core components:
- The Chi-Squared Statistic (χ²): The calculated value from the formula.
- Degrees of Freedom (df): Represents the number of independent pieces of information used in calculating the statistic. For a contingency table, df = (Number of Rows – 1) * (Number of Columns – 1).
- P-value: The probability of observing the obtained results (or more extreme results) if there was truly no association between the variables.
- Sample Size (N): The total number of participants or observations in the study.
- Descriptive Statistics: A concise summary of the observed frequencies or proportions for each group.
- Contextual Interpretation: A clear explanation of what the results mean in the context of the research question.
Standardized Reporting Format
A common format for reporting the Chi-Squared test is:
χ²(df, N = sample size) = Chi-Squared Statistic, p = p-value
For example:
χ²(1, N = 220) = 6.67, p = .009
This indicates a Chi-Squared statistic of 6.67 with 1 degree of freedom and a sample size of 220, resulting in a p-value of 0.009.
Interpretation of the P-value
- If p ≤ α (alpha level, typically 0.05), the result is considered statistically significant. This suggests that there is a statistically significant association between the variables. We would reject the null hypothesis (which states there’s no association). In our example (p = 0.009), the result is statistically significant at α = 0.05.
- If p > α, the result is not statistically significant. This suggests that there is no statistically significant association between the variables. We fail to reject the null hypothesis.
Including Descriptive Statistics
Alongside the Chi-Squared results, always provide descriptive statistics to give context to the findings. For instance, in the Brand Preference example:
"Sample 1 showed a preference for Brand A (50/110, 45.5%) compared to Sample 2 (70/110, 63.6%). The Chi-Squared test revealed a significant association between sample group and brand preference, χ²(1, N = 220) = 6.67, p = .009."
Example Reporting in a Research Paper
"To examine the relationship between treatment group (intervention vs. control) and patient satisfaction (satisfied vs. dissatisfied), a Chi-Squared test was conducted. The results indicated a significant association between the two variables, χ²(1, N = 150) = 10.24, p = .001. Patients in the intervention group were significantly more likely to report satisfaction (75%) compared to those in the control group (55%)."
Addressing Common Pitfalls in Reporting
Avoid these common errors when reporting chi squared for two different samples:
- Forgetting Degrees of Freedom: Always include the degrees of freedom.
- Omitting the P-value: The p-value is critical for determining statistical significance.
- Failing to Report Sample Size: Provide the total sample size (N).
- Misinterpreting Non-Significance: A non-significant result doesn’t "prove" the null hypothesis; it simply means there isn’t enough evidence to reject it.
- Ignoring Expected Cell Count Violations: If assumptions are violated, acknowledge them and consider alternative tests. Report what tests were used to check assumptions and the results.
- Not providing descriptive data: Always offer summary statistics that allow the reader to understand the direction of the observed effect.
When Not to Use the Chi-Squared Test
The Chi-Squared test is not always the most appropriate choice. Consider the following:
- Small Sample Sizes: With very small sample sizes and/or low expected cell counts, Fisher’s Exact Test is often a better alternative.
- Related Samples: If your samples are related (e.g., measuring the same individuals at two different time points), consider using McNemar’s Test instead.
By adhering to these guidelines, you can confidently and accurately report chi squared for two different samples, ensuring your findings are clear, reproducible, and meaningful.
FAQs: Chi-Squared Test for Two Samples
This FAQ section provides quick answers to common questions about using the Chi-Squared test to compare two samples, complementing the main article.
What exactly does a Chi-Squared test tell me when comparing two samples?
The Chi-Squared test determines if there’s a statistically significant association between two categorical variables derived from two different samples. Specifically, it assesses whether the observed frequencies in your data significantly deviate from what you’d expect if the variables were independent. This helps you understand if there’s a real relationship beyond random chance. Reporting chi squared for two different samples is straightforward, focusing on the Chi-Squared statistic, degrees of freedom, and p-value.
When is it appropriate to use a Chi-Squared test for comparing samples?
Use a Chi-Squared test when you have two independent samples and want to analyze the relationship between two categorical variables (variables with categories, like colors or opinions). The data must be in frequency format (counts of observations falling into each category) and sample sizes should be large enough to ensure accurate results.
What does a statistically significant result from a Chi-Squared test mean in practice?
A statistically significant p-value (typically p < 0.05) suggests the observed association between the two categorical variables is unlikely to have occurred by chance. You can conclude there is an association or dependency between the variables within the two different samples. However, it doesn’t imply causation. Reporting chi squared for two different samples requires stating the p-value, which is used to determine statistical significance.
What are the common mistakes to avoid when performing a Chi-Squared test?
Ensure your data meets the test’s assumptions: independent observations, categorical variables, and expected cell counts that are not too small (generally, all expected counts should be 5 or greater). Avoid using the Chi-Squared test with continuous data or paired data. Also, remember that statistical significance doesn’t automatically equal practical significance. Properly reporting chi squared for two different samples involves verifying that the assumptions were valid for your sample data.
And that’s a wrap! Hopefully, you now feel more confident in your ability to perform and understand reporting chi squared for two different samples. Now go forth and statistically conquer! Don’t hesitate to revisit this guide whenever you need a little refresher. Until next time!
