Mastering Benzene Ring ID: FTIR Spectroscopy Guide
Fourier Transform Infrared (FTIR) spectroscopy serves as a cornerstone technique for molecular structure elucidation, especially in organic chemistry. The American Chemical Society (ACS) recognizes benzene ring FTIR analysis as a crucial component for confirming the presence of aromatic compounds. Characteristic absorption bands, often analyzed with software like Thermo Fisher’s OMNIC, provide definitive fingerprints for the benzene ring‘s vibrational modes. Understanding these spectral features allows researchers in laboratories worldwide to accurately identify and quantify benzene derivatives within complex mixtures.
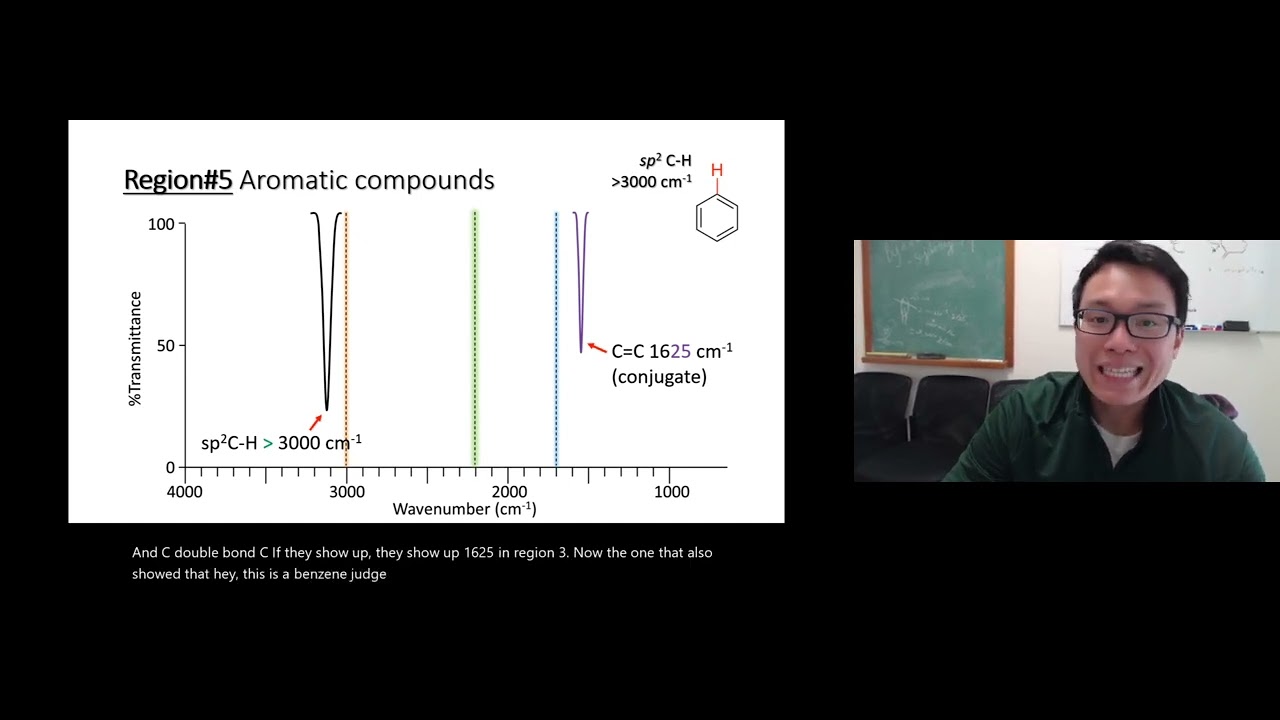
Image taken from the YouTube channel Pete Punthasee , from the video titled IR Video 11 – Region 5 Benzene and Aromatic Compounds .
Fourier Transform Infrared (FTIR) Spectroscopy stands as a cornerstone analytical technique, providing invaluable insights into the molecular composition of diverse materials. Its power lies in its ability to probe the vibrational modes of molecules, generating unique spectral fingerprints that reveal their identity.
The Power of FTIR Spectroscopy
At its core, FTIR Spectroscopy operates by measuring the absorption of infrared radiation by a sample. When infrared light interacts with a molecule, specific frequencies are absorbed, causing vibrational excitation of the molecule’s bonds.
By analyzing the pattern of absorbed frequencies, a spectrum is generated.
This spectrum acts as a molecular fingerprint, unique to the compound or mixture being analyzed.
The Significance of Benzene Ring Identification
Within the vast landscape of organic chemistry, the benzene ring holds particular significance. This cyclic structure, composed of six carbon atoms and six hydrogen atoms, forms the foundation of countless aromatic compounds.
These compounds play vital roles in pharmaceuticals, polymers, dyes, and a multitude of other industrial applications.
Consequently, the ability to accurately and rapidly identify benzene rings is of paramount importance across various scientific and industrial domains.
The presence or absence of a benzene ring can drastically alter a compound’s properties and reactivity.
Therefore, reliable identification is crucial for quality control, research and development, and regulatory compliance.
Guide Overview: A Comprehensive Approach
This guide is dedicated to providing a comprehensive understanding of how FTIR Spectroscopy can be effectively employed for the identification of benzene rings.
It will delve into the key wavenumber regions within the FTIR spectrum that are indicative of the presence of this crucial structural motif.
Furthermore, this guide will explore the nuances of spectral interpretation.
Focus will be given to differentiating benzene ring signatures from those of other functional groups.
Ultimately, this guide aims to equip readers with the knowledge and skills necessary to confidently and accurately identify benzene rings using FTIR Spectroscopy.
The Benzene Ring: Structure and Vibrational Fingerprints
Having established the significance of identifying benzene rings using FTIR spectroscopy, it’s essential to understand the fundamental structure and vibrational properties that make this identification possible. The unique arrangement of atoms within the benzene ring gives rise to distinct vibrational modes, which in turn produce characteristic patterns in FTIR spectra. These spectral fingerprints are the key to accurately identifying the presence of a benzene ring in a sample.
Unveiling the Benzene Ring’s Structure
The benzene ring, with its chemical formula C6H6, is a cyclic, planar molecule consisting of six carbon atoms arranged in a hexagonal ring, with each carbon atom bonded to one hydrogen atom. The defining feature of the benzene ring is the delocalization of electrons within the ring, forming a system of pi bonds that extends across all six carbon atoms.
This delocalization imparts exceptional stability to the benzene ring and gives rise to its aromatic character.
Each carbon-carbon bond in benzene possesses a bond order of 1.5, intermediate between a single and a double bond, indicating the equal sharing of electrons across the entire ring.
The uniform bond lengths and angles contribute to the symmetrical structure and stability of the benzene molecule.
Vibrational Modes: The Language of the Benzene Ring
Molecules are not static entities; their atoms are constantly in motion, vibrating around their equilibrium positions. These vibrations occur at specific frequencies, determined by the masses of the atoms and the strengths of the chemical bonds. These vibrational modes can be broadly categorized into stretching and bending vibrations.
Stretching vibrations involve changes in the bond length between two atoms, while bending vibrations involve changes in the bond angle between three or more atoms.
The benzene ring, with its complex structure and network of bonds, exhibits a variety of vibrational modes, each corresponding to a specific frequency.
These vibrational modes are highly sensitive to the environment of the benzene ring, including the presence of substituents or interactions with neighboring molecules.
From Vibration to Spectrum: Decoding the FTIR Signal
When a molecule is irradiated with infrared radiation, it absorbs energy at frequencies that match the frequencies of its vibrational modes.
This absorption of energy causes an excitation of the vibrational mode, leading to a decrease in the intensity of the transmitted infrared radiation at that specific frequency.
An FTIR spectrometer measures the intensity of the transmitted infrared radiation as a function of frequency, generating a spectrum that displays the absorption characteristics of the molecule.
The FTIR spectrum of a compound is a unique fingerprint, reflecting its molecular structure and composition.
In the case of benzene rings, the characteristic vibrational modes give rise to distinct peaks in the FTIR spectrum, providing valuable information about the presence and nature of the benzene ring. By analyzing the positions, intensities, and shapes of these peaks, one can gain insights into the structure and environment of the benzene ring within a sample.
Decoding the Spectrum: Key Wavenumber Regions for Benzene Ring Identification
Understanding the structure and vibrational modes of the benzene ring is only the first step. The real power of FTIR spectroscopy lies in its ability to translate these vibrations into a spectral fingerprint.
This section delves into the specific wavenumber regions within the FTIR spectrum that serve as telltale signs of a benzene ring’s presence. We’ll explore the significance of each region, providing you with the knowledge to confidently analyze FTIR spectra and identify aromatic compounds.
The C-H Stretching Region: 3100-3000 cm⁻¹
The region between 3100 and 3000 cm⁻¹ is where C-H stretching vibrations manifest. Aromatic C-H stretches typically appear as sharp, distinct peaks within this range.
These peaks are generally observed at slightly higher wavenumbers than those associated with aliphatic C-H stretches, which usually fall below 3000 cm⁻¹. The presence of one or more sharp peaks in this region is a strong initial indicator of an aromatic compound.
It is imperative, however, to consider the intensity and shape of the peaks, as well as their precise location within the 3100-3000 cm⁻¹ range. Subtle variations can provide additional clues about the structure and environment of the benzene ring.
The C=C Stretching Region: 1600-1450 cm⁻¹
The most diagnostic region for identifying benzene rings lies between 1600 and 1450 cm⁻¹. Here, you’ll find multiple peaks corresponding to the stretching vibrations of the carbon-carbon bonds within the aromatic ring.
Typically, two to four peaks will be observed in this region, often described as a "fingerprint" unique to aromatic compounds. These peaks arise from the various modes of vibration involving the delocalized pi electrons within the benzene ring.
The exact positions and intensities of these peaks can be influenced by substituents attached to the ring. Identifying this multiplet pattern is crucial for confirming the presence of a benzene ring.
The absence of these peaks casts significant doubt on the presence of an aromatic system, even if other spectral features are suggestive.
The Out-of-Plane C-H Bending Region: 900-650 cm⁻¹
The region between 900 and 650 cm⁻¹ is associated with out-of-plane (oop) bending vibrations of the C-H bonds.
While often more complex and sensitive to environmental factors, this region provides valuable information about the substitution pattern on the benzene ring. The number and position of substituents directly influence the number and position of peaks in this region.
For instance, monosubstituted benzene rings typically exhibit a strong absorption band near 750-700 cm⁻¹, along with a weaker band around 690 cm⁻¹. Ortho-disubstituted rings often show a single strong band between 770 and 735 cm⁻¹.
Careful analysis of the oop bending region can help differentiate between different isomers and determine the arrangement of substituents around the benzene ring. However, interpretation requires expertise and consideration of other spectral data.
The peaks in this region are often broader and more susceptible to interference from other vibrational modes, making their interpretation more challenging.
Optimizing Your Analysis: Sample Preparation and Data Acquisition Best Practices
The accuracy and reliability of FTIR spectroscopy hinge not only on spectral interpretation but also critically on the quality of the data acquired. This, in turn, depends heavily on meticulous sample preparation and the correct selection of instrument settings. Failing to adhere to best practices in these areas can introduce artifacts, mask important spectral features, and ultimately lead to misidentification of benzene rings.
This section serves as a guide to optimizing your analysis by focusing on key aspects of sample preparation and data acquisition. We will explore essential techniques to ensure you obtain high-quality FTIR spectra for confident benzene ring identification.
The Foundation: Best Practices for Sample Preparation
The quality of your FTIR spectrum is inextricably linked to the quality of your sample preparation. Different sampling techniques exist, each with its own set of considerations for aromatic compounds.
The goal is always to present a sample to the FTIR instrument that is representative of the material being analyzed and free from contaminants that might interfere with the spectral analysis.
Choosing the Right Technique
Solid samples can be analyzed using techniques like KBr pellets, attenuated total reflectance (ATR), or diffuse reflectance infrared Fourier transform spectroscopy (DRIFTS). Liquid samples can be analyzed as thin films between salt plates or using specialized liquid cells with controlled pathlengths. Gas samples require gas cells with defined pathlengths.
The ATR technique is often preferred for its ease of use and minimal sample preparation, particularly for solids and viscous liquids. However, it’s crucial to ensure good contact between the sample and the ATR crystal.
The KBr pellet technique, while requiring more preparation, can provide excellent spectral quality for solid samples, provided the sample is finely ground and evenly dispersed in the KBr matrix.
Minimizing Contamination
Contamination is a significant source of error in FTIR spectroscopy. Impurities can introduce extraneous peaks, obscure genuine signals, or alter the relative intensities of peaks, leading to misinterpretations.
Therefore, it is essential to use high-purity solvents and reagents during sample preparation.
Furthermore, thoroughly clean all sampling accessories before and after each use to prevent cross-contamination between samples.
Achieving Optimal Sample Thickness
For transmission-based techniques (e.g., KBr pellets, thin films), sample thickness is a critical parameter. If the sample is too thick, the spectrum may exhibit excessive absorbance, leading to saturation and loss of spectral detail.
Conversely, if the sample is too thin, the signal-to-noise ratio may be poor, making it difficult to identify weak but important bands.
Optimizing sample thickness often involves experimentation to find the sweet spot that provides adequate signal strength without excessive absorbance. This may involve adjusting the concentration of the sample in a solvent or varying the pressure applied when preparing a KBr pellet.
Instrument Settings and Parameters for Aromatic Compound Analysis
Once you have prepared your sample, the next crucial step is to configure the FTIR instrument with appropriate settings to maximize the quality of the resulting spectrum.
Resolution
The resolution of the FTIR spectrometer determines its ability to distinguish between closely spaced peaks. For benzene ring identification, a resolution of 4 cm⁻¹ or better is generally recommended.
This level of resolution is usually sufficient to resolve the closely spaced peaks in the C=C stretching region (1600-1450 cm⁻¹), which are particularly diagnostic for aromatic compounds.
Scan Number
The number of scans acquired for each spectrum directly affects the signal-to-noise ratio. Increasing the number of scans averages out random noise, resulting in a cleaner spectrum with better-defined peaks.
For most applications, 32 to 64 scans are sufficient, but for samples with low concentrations of aromatic compounds, a higher number of scans may be necessary.
Apodization Function
The apodization function is a mathematical function applied to the interferogram before Fourier transformation to reduce sidelobes and improve the appearance of the spectrum.
Different apodization functions have different effects on the resolution and signal-to-noise ratio. A triangular or Happ-Genzel apodization function is often a good choice for general-purpose FTIR spectroscopy, but experimenting with different functions may be beneficial for specific applications.
Detector Selection
The detector is the heart of the FTIR spectrometer. Different detectors are sensitive to different regions of the infrared spectrum. For most applications involving aromatic compounds, a DTGS (deuterated triglycine sulfate) detector is adequate.
However, for applications requiring higher sensitivity or extended spectral range, a liquid nitrogen-cooled MCT (mercury cadmium telluride) detector may be preferred.
Avoiding Common Pitfalls in Spectral Interpretation
Even with careful sample preparation and optimized instrument settings, several common pitfalls can still lead to inaccurate spectral interpretation. Awareness of these pitfalls is crucial for ensuring the reliability of your analysis.
Water Vapor and Carbon Dioxide
Water vapor and carbon dioxide are ubiquitous in the atmosphere and can introduce interfering peaks into FTIR spectra, particularly in the regions around 3700-3500 cm⁻¹ (O-H stretching) and 2360-2340 cm⁻¹ (CO₂ stretching).
To minimize these interferences, purge the FTIR spectrometer with dry, CO₂-free air or nitrogen before acquiring spectra. Background subtraction can also help to remove residual water vapor and carbon dioxide peaks.
Baseline Correction
The baseline of an FTIR spectrum can be affected by various factors, including scattering from the sample, variations in detector response, and atmospheric absorption.
A sloping or uneven baseline can distort the shape and intensity of peaks, making it difficult to accurately identify and quantify aromatic compounds.
Therefore, it is essential to perform baseline correction before interpreting the spectrum. Most FTIR software packages provide automatic baseline correction algorithms, but manual adjustment may be necessary in some cases.
Overlapping Peaks
In complex samples, the peaks of different compounds or functional groups may overlap, making it difficult to distinguish between them.
Deconvolution techniques can sometimes be used to separate overlapping peaks, but these techniques should be applied with caution, as they can introduce artifacts if not used properly.
Careful spectral subtraction of known components can also help to isolate the peaks of interest.
Step-by-Step Spectral Interpretation: Identifying Benzene Ring Signatures
Having prepared your sample meticulously and acquired high-quality data, the next crucial step is interpreting the FTIR spectrum. This is where the knowledge of characteristic wavenumber regions, combined with a systematic approach, allows you to confidently identify the presence of benzene rings.
Deciphering the FTIR Spectrum: A Systematic Approach
Interpreting an FTIR spectrum effectively requires a methodical approach. Jumping to conclusions based on a single peak can lead to misidentification. Instead, adopt a step-by-step strategy to build a strong case for the presence of a benzene ring.
-
Baseline Correction and Normalization: Ensure your spectrum is properly baseline-corrected to remove any artificial offsets. Normalization can also be helpful to compare spectra from different instruments or concentrations.
-
Initial Survey: Scan the entire spectrum (4000-400 cm⁻¹) to get an overview of all the prominent peaks. Note their positions and relative intensities.
Pinpointing Benzene Ring Peaks
The next step involves focusing on the key regions known to exhibit characteristic benzene ring vibrations. Remember, the presence of peaks in these regions is suggestive, not definitive, evidence.
-
C-H Stretching Region (3100-3000 cm⁻¹): Aromatic C-H stretches typically appear as sharp peaks in this region, just above 3000 cm⁻¹. The intensity can vary depending on the concentration and the substituents on the ring.
-
C=C Stretching Region (1600-1450 cm⁻¹): Benzene rings often exhibit multiple peaks in this region due to in-plane vibrations of the aromatic ring. Look for a pattern of two to four peaks. Their exact positions and intensities provide clues about the ring’s substitution pattern.
-
Out-of-Plane C-H Bending Region (900-650 cm⁻¹): This region is particularly useful for determining the substitution pattern on the benzene ring. The number and position of peaks in this region are highly sensitive to the arrangement of substituents.
Differentiating Benzene Ring Peaks from Other Functional Groups
A critical aspect of spectral interpretation is distinguishing benzene ring peaks from those arising from other functional groups. This requires careful consideration of peak shapes, intensities, and the overall spectral context.
-
Aliphatic vs. Aromatic C-H: Aliphatic C-H stretches appear below 3000 cm⁻¹, while aromatic C-H stretches appear above 3000 cm⁻¹. This difference is crucial for distinguishing between the two.
-
Carbonyl Compounds: Carbonyl (C=O) groups, commonly found in ketones, aldehydes, and esters, exhibit strong absorption in the 1800-1650 cm⁻¹ region. This region overlaps with the C=C stretching region of benzene rings. However, carbonyl peaks are typically much stronger and broader.
-
Alkenes: Alkenes also exhibit C=C stretching vibrations, but their peaks are generally sharper and less numerous than those of aromatic rings. Additionally, alkenes usually lack the characteristic out-of-plane bending modes observed in benzene rings.
Leveraging Reference Libraries and Databases
To confirm your spectral interpretation, it is essential to consult reference libraries and databases. These resources contain vast collections of FTIR spectra of known compounds, providing a valuable basis for comparison.
-
Commercial Libraries: Several commercial vendors offer comprehensive FTIR spectral libraries, often categorized by compound class. These libraries can be searched by peak position or chemical structure.
-
Online Databases: Free online databases, such as the NIST Chemistry WebBook, provide access to reference spectra for a wide range of compounds.
-
Published Literature: Scientific journals and books often contain FTIR spectra of specific compounds or materials. Searching the literature can be particularly useful for identifying less common compounds.
By comparing your sample’s spectrum to reference spectra, you can gain confidence in your identification of benzene rings and rule out alternative possibilities. Remember that spectral matching is rarely perfect. Consider the purity of your sample, potential matrix effects, and instrument variations when evaluating the degree of similarity.
Deciphering the information held within an FTIR spectrum is a powerful skill, but its true value shines when applied to real-world scenarios. Let’s delve into some case studies that showcase how FTIR spectroscopy can be used to identify benzene rings in various materials. These examples will highlight common challenges encountered during spectra interpretation, and offer effective solutions to overcome them.
Real-World Applications: Case Studies in Benzene Ring Identification
The ability to accurately identify benzene rings using FTIR spectroscopy has profound implications across diverse fields. From ensuring the quality of polymer materials to monitoring environmental pollutants, this analytical technique provides critical insights. The following case studies illustrate how FTIR spectroscopy is applied in practice, revealing both its strengths and the challenges that analysts often face.
Case Study 1: Identifying Benzene Rings in Polymer Materials
Many polymers, particularly those used in plastics, resins, and adhesives, contain aromatic components. Identifying the presence and concentration of these benzene rings is crucial for quality control, material characterization, and understanding the polymer’s properties.
For instance, consider a scenario where a manufacturer suspects that a batch of polystyrene resin has been contaminated with another polymer. FTIR spectroscopy can be employed to quickly verify the presence of the characteristic benzene ring peaks.
Polystyrene, with its pendant phenyl groups, exhibits strong absorbance in the C-H stretching region (3100-3000 cm⁻¹) and the C=C stretching region (1600-1450 cm⁻¹).
By comparing the spectrum of the suspect batch with that of a known standard, any deviations in peak positions or intensities can be readily detected. The presence of additional peaks, or the absence of expected ones, might indicate the presence of contaminants or inconsistencies in the polymerization process.
Challenges in Polymer Analysis
Polymer analysis can be complex because polymers often contain additives, fillers, and other components that can complicate the FTIR spectrum. The overlapping peaks from these various substances can make it difficult to isolate and identify the benzene ring signatures.
Solutions for Polymer Analysis
To address these challenges, several strategies can be employed. Spectral subtraction techniques can be used to remove the contribution of known additives from the spectrum.
Additionally, multivariate analysis methods, such as principal component analysis (PCA), can be used to identify subtle differences between polymer samples based on their FTIR spectra, even in the presence of complex mixtures.
Case Study 2: Analyzing Aromatic Compounds in Environmental Samples
FTIR spectroscopy plays a crucial role in environmental monitoring, particularly in detecting and quantifying aromatic pollutants in water, soil, and air samples. Aromatic compounds, such as benzene, toluene, ethylbenzene, and xylene (BTEX), are common contaminants associated with industrial activities, oil spills, and vehicle emissions.
Imagine a scenario where water samples are collected near an industrial site to assess the potential for groundwater contamination. FTIR spectroscopy can be used to rapidly screen these samples for the presence of aromatic compounds.
By extracting the organic compounds from the water sample and analyzing the extract using FTIR, the characteristic benzene ring peaks can be identified and quantified.
The intensity of these peaks is directly proportional to the concentration of the aromatic compounds, allowing for accurate determination of pollutant levels.
Challenges in Environmental Analysis
Environmental samples often contain complex mixtures of organic and inorganic compounds, making spectral interpretation challenging. The concentrations of aromatic pollutants may also be very low, requiring sensitive analytical techniques. Furthermore, matrix effects, caused by the interaction of the analyte with the sample matrix, can influence the FTIR spectrum.
Solutions for Environmental Analysis
To enhance the sensitivity and accuracy of FTIR analysis in environmental applications, sample pre-concentration techniques, such as solid-phase extraction (SPE), can be used to isolate and concentrate the aromatic compounds.
Additionally, advanced spectral analysis methods, such as partial least squares (PLS) regression, can be employed to calibrate the FTIR spectra against known concentrations of aromatic compounds, compensating for matrix effects and improving quantitative accuracy.
Overcoming Challenges in Spectra Interpretation
Successfully identifying benzene rings in real-world samples requires careful attention to detail and a thorough understanding of potential challenges. Here are some general strategies to improve spectra interpretation:
- Baseline Correction and Normalization: Always ensure that the FTIR spectrum is properly baseline-corrected to remove any artificial offsets. Normalization can also be helpful to compare spectra from different instruments or concentrations.
- Spectral Libraries and Databases: Utilize spectral libraries and databases to compare the obtained spectrum with known standards. This can aid in identifying unknown components and confirming the presence of benzene ring signatures.
- Consult with Experts: Do not hesitate to consult with experienced spectroscopists or analytical chemists when facing difficult interpretation challenges. Their expertise can provide valuable insights and guidance.
By applying these strategies and carefully considering the specific characteristics of the sample being analyzed, it is possible to confidently and accurately identify benzene rings using FTIR spectroscopy in a wide range of real-world applications.
Frequently Asked Questions: Identifying Benzene Rings with FTIR
Here are some common questions related to identifying benzene rings using FTIR spectroscopy. We hope these answers clarify the process and improve your analysis.
What are the key FTIR peaks to look for when identifying a benzene ring?
When identifying a benzene ring using FTIR, focus on several key regions. Look for sharp peaks in the 3100-3000 cm⁻¹ range due to C-H stretching. Also, observe peaks in the 1600-1450 cm⁻¹ range for aromatic ring vibrations. Lastly, pay attention to the out-of-plane C-H bending vibrations below 900 cm⁻¹, which can provide information about the substitution pattern on the benzene ring.
Why is the 1600-1450 cm⁻¹ region so important for benzene ring identification?
The 1600-1450 cm⁻¹ region is crucial because it represents the characteristic ring vibrations of the benzene ring structure. These peaks are usually quite distinct and can confirm the presence of an aromatic system, even when other peaks are weak or overlapping. Analyzing this region helps confirm the presence of a benzene ring ftir signature in your sample.
Can FTIR distinguish between different substitution patterns on a benzene ring?
Yes, to some extent. The out-of-plane C-H bending vibrations below 900 cm⁻¹ are sensitive to the substitution pattern on the benzene ring. For instance, mono-substituted rings often show strong absorptions in the 770-710 cm⁻¹ range. However, interpreting these patterns can be complex and may require comparison to reference spectra.
What limitations does FTIR have in identifying benzene rings?
While FTIR is valuable, it has limitations. Overlapping peaks from other functional groups can complicate analysis. Furthermore, weak signals might be difficult to detect, especially with low concentrations. Also, it can be challenging to differentiate between benzene ring ftir spectra of highly similar aromatic compounds without careful analysis.
Alright, you’ve now got the essentials for nailing down that benzene ring FTIR identification! Go give it a try in the lab. Hope this helps, and good luck!
